使用 tape 与 Phoenix 观察 Bub
本教程提供两条观察同一个 Bub workspace 的路径:
- 先运行一个小的英文自然语言任务,再询问 Bub 刚写入的 tape。由于 Bub 会把每个 session 记录为 append-only tape,这条路径不依赖外部 tracing backend。
- 在运行同类任务时,将 OpenTelemetry telemetry 发送到 Phoenix。需要把 GenAI trace 放到本地或生产可观测平台时使用这条路径。
完成后,你会得到一个本地快速健康检查方式,以及一个用于查看 agent、model 和 tool 活动的 Phoenix trace 视图。
你需要:
- Bub 已安装,且
uv run bub --help可以运行。 - 一个 workspace,其中
uv run bub run "What tools do you have?"能调用已配置的模型。 - 如果要本地运行 Phoenix,需要 Docker 或 Podman。
- 启动带 Phoenix 的 Bub 之前,安装 Logfire extra:
uv sync --extra logfire- 安装
bub-tapestore-otelcontrib 插件,获得更丰富的 tape 与 agent span:
bub install bub-tapestore-otel@main1. 询问 Bub 当前 tape
Section titled “1. 询问 Bub 当前 tape”先运行一个英文自然语言任务:
uv run bub run "What tools do you have, and what small tasks are they useful for?"然后让 Bub 检查刚刚被这个 turn 更新过的 tape:
uv run bub run ",tape.info"期望输出类似:
name: becda04eb9f7369c__065943a03cbe6395
entries: 98
anchors: 2
last_anchor: session/start
entries_since_last_anchor: 44
last_token_usage: 7458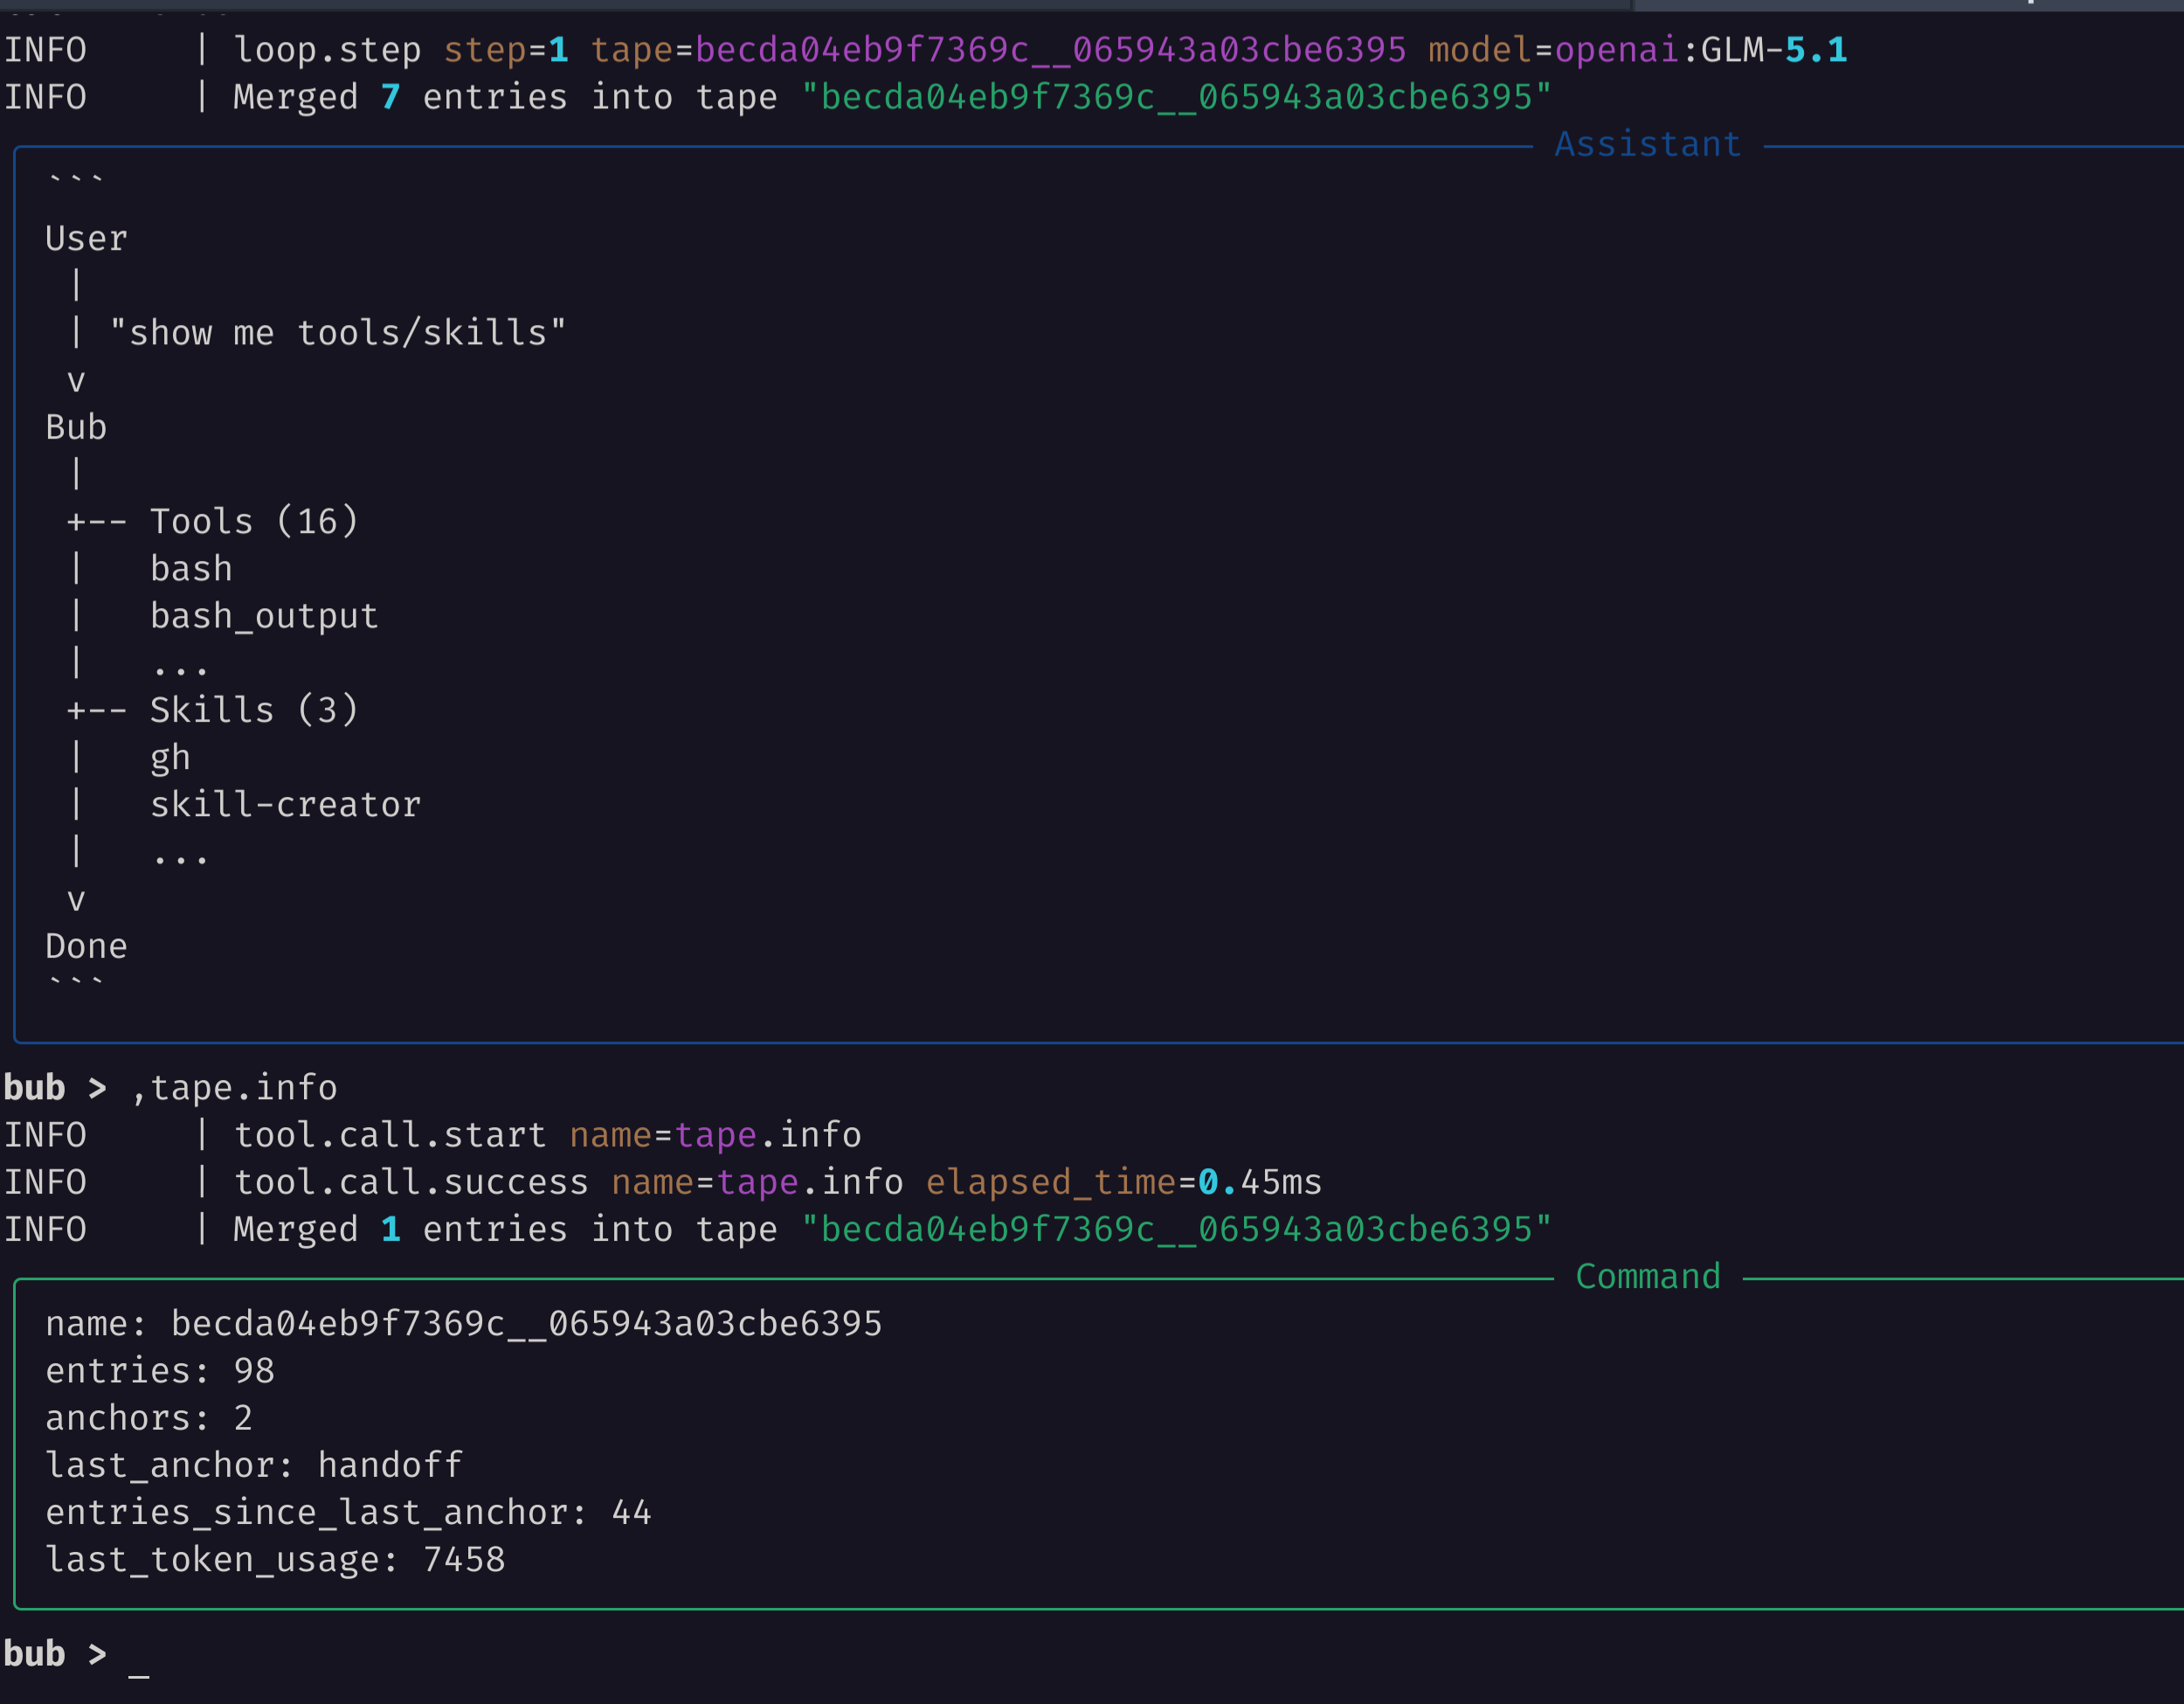
这些字段在模型行为异常时很有用:
entries表示 session 已积累多少历史。anchors与last_anchor表示 tape 是否已有用于重建 context 的 checkpoint。entries_since_last_anchor表示是否可以通过 handoff 缩短下一次 prompt。last_token_usage会在模型路径记录 token usage 后出现。
由于 Bub 使用来自 tape.systems 的 tape 模型,运行时可以检查自己的操作记录。Bub 能回答发生了什么,是因为 tape 正是它重建 context 时使用的状态。
2. 在 tape 中搜索症状
Section titled “2. 在 tape 中搜索症状”需要查找之前的 tool call、error 或 handoff 时,使用 tape.search:
uv run bub run ",tape.search query=loop.step"你也可以让模型检查 tape 并解释它看到的变化:
uv run bub run "Inspect the current tape and summarize the last turn."第二条命令可能会调用模型,因此只在 provider credential 已配置后使用。
3. 在本地启动 Phoenix
Section titled “3. 在本地启动 Phoenix”运行启用 OTLP HTTP ingest 的 Phoenix:
docker run --rm --name bub-phoenix \
  -p 6006:6006 \
  arizephoenix/phoenix:latest
打开 UI:
http://localhost:60064. 使用 contrib 与 OTLP 运行 Bub
Section titled “4. 使用 contrib 与 OTLP 运行 Bub”安装 logfire extra 后,Bub 在 CLI 启动时已经支持 Logfire。bub-tapestore-otel contrib 插件会从 Bub tape store 生成面向 GenAI 的 span,包括 invoke_agent bub、bub.agent.step、chat 和 tool execution span。本教程通过 OTLP 把两者发送到 Phoenix。
在另一个终端运行:
LOGFIRE_SEND_TO_LOGFIRE=false \
LOGFIRE_SERVICE_NAME=bub \
BUB_TAPESTORE_OTEL_ENABLED=true \
BUB_TAPESTORE_OTEL_SERVICE_NAME=bub \
BUB_TAPESTORE_OTEL_AGENT_NAME=bub \
OTEL_EXPORTER_OTLP_TRACES_ENDPOINT=http://localhost:6006/v1/traces \
OTEL_EXPORTER_OTLP_TRACES_PROTOCOL=http/protobuf \
uv run --extra logfire bub run "What tools do you have, and what small tasks are they useful for?"
然后用相同 telemetry 设置运行本地 tape 检查:
LOGFIRE_SEND_TO_LOGFIRE=false \
LOGFIRE_SERVICE_NAME=bub \
BUB_TAPESTORE_OTEL_ENABLED=true \
BUB_TAPESTORE_OTEL_SERVICE_NAME=bub \
BUB_TAPESTORE_OTEL_AGENT_NAME=bub \
OTEL_EXPORTER_OTLP_TRACES_ENDPOINT=http://localhost:6006/v1/traces \
OTEL_EXPORTER_OTLP_TRACES_PROTOCOL=http/protobuf \
uv run --extra logfire bub run ",tape.info"
本地 Phoenix 教程建议设置 LOGFIRE_SEND_TO_LOGFIRE=false,避免 Bub 尝试把 telemetry 发送到托管 Logfire backend。OTEL_EXPORTER_OTLP_TRACES_ENDPOINT 指向 Phoenix 的 OTLP HTTP endpoint。
5. 在 Phoenix 中检查 trace
Section titled “5. 在 Phoenix 中检查 trace”在 Phoenix 中:
- 打开 default project。
- 打开最近的 trace。
- 查找
invoke_agent bub、bub.agent.step、chat <model>和execute_tool <tool>span。
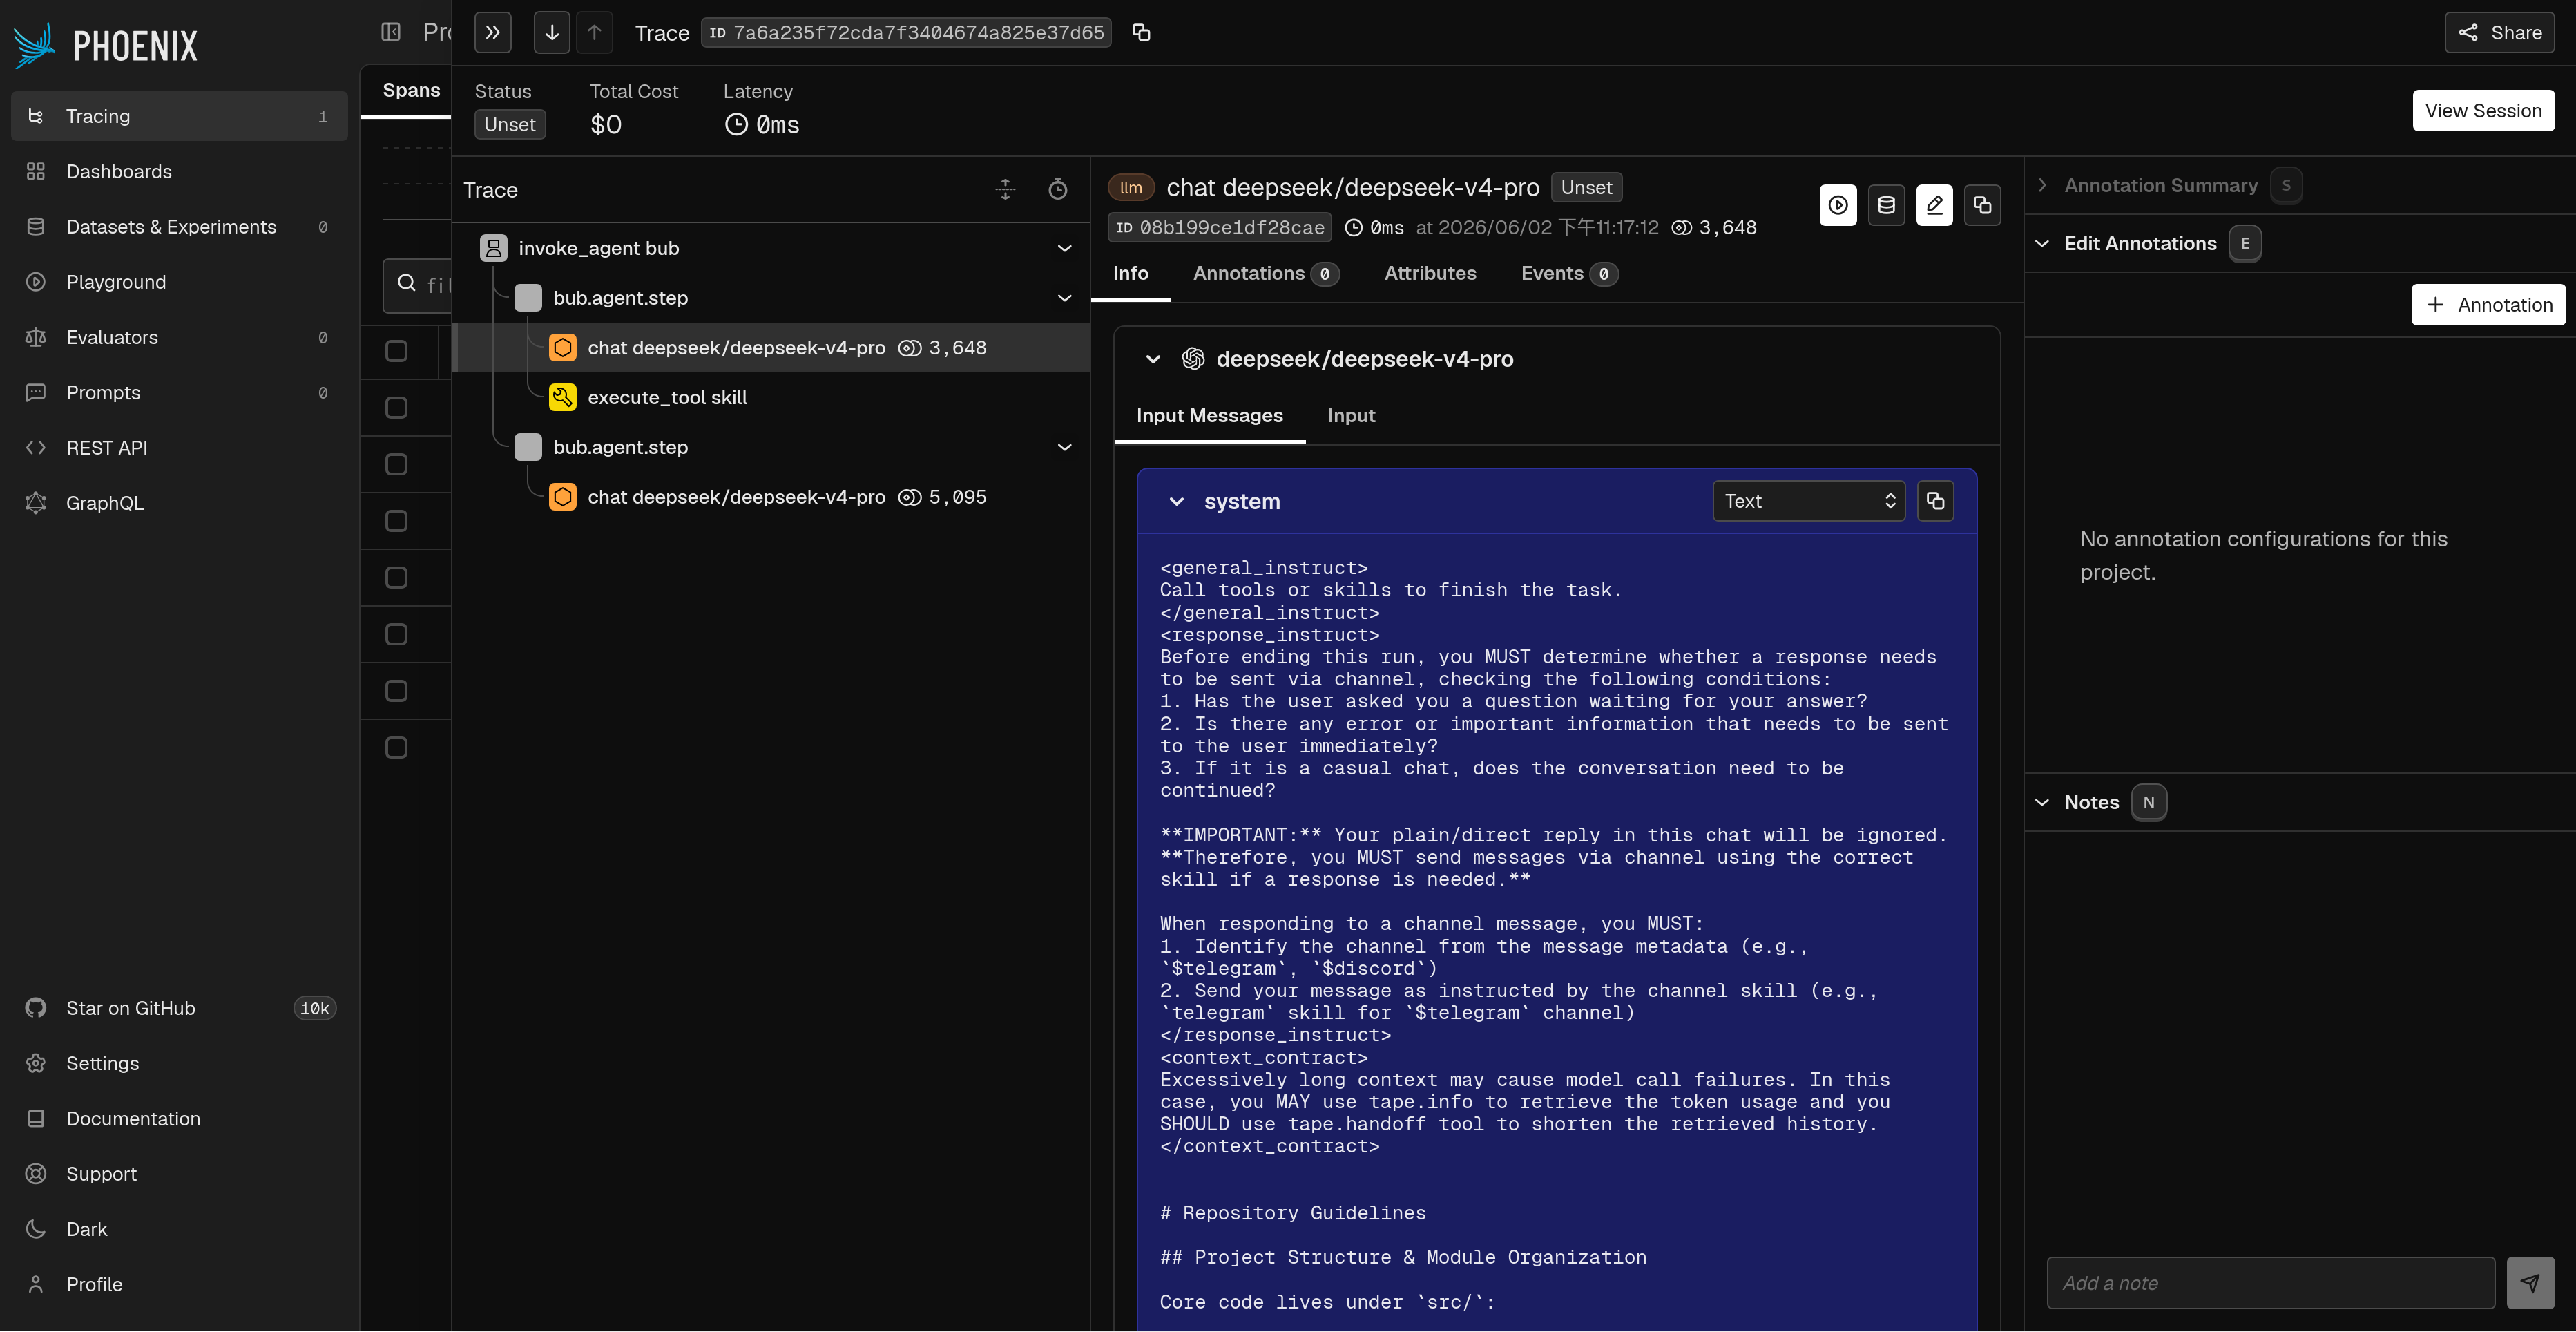
这条路径与 tape 检查互补:
- Tape 回答“这个 Bub session 记住了什么?”
- Phoenix 回答“这个 Bub agent turn 如何经过 model call、tool call 和 tape update?”
排查生产行为时建议两者一起使用:先用 ,tape.info 判断 session 状态,再用 Phoenix 查看耗时、错误、model call 和 tool call。
如果 Phoenix 在前台运行,用 Ctrl+C 停止。若以 detached 方式运行,删除容器:
docker rm -f bub-phoenix- Tape 与 context — 理解 Bub 记录什么,以及如何重建 context。